回歸模型(線性或非線性)被廣泛應用於數值預測,比如薪水,銷售額等等。如果說自變數(independent variable)是時間,那麼我們是在預測未來的數值;反之我們的模型在預測當前未知的數值。
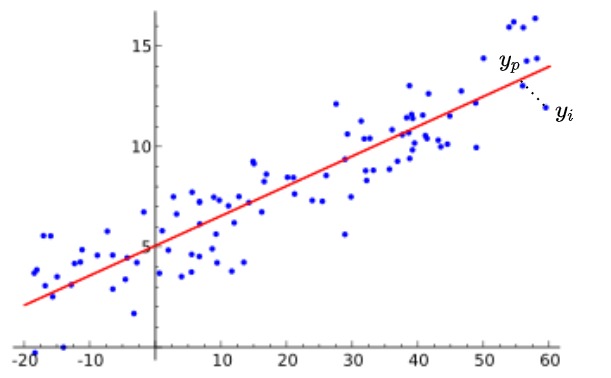
簡單線性回歸,由自變量 $X$ 來預測因變量 $Y$ 的方法,假設這兩個變量是相關的線性,可嘗試尋找依據特徵($x$)的線性函數來擬合並預測($y$)。

from wiki
上圖中,紅線可以用 $y=ax+b$ 求得,且該紅線是能代表該資料的一條線,其 $a$ 為斜率;$b$ 為y截距。$y$ 為應變數 ,$x$ 為自變數。然而為了找到最佳擬合的線,會使最小平方法,該方法盡可能的讓預測值與實際值的誤差為最小。其公式如下,並對應下圖,$y_i$ 為實際值;$y_p$ 為預測值。
$$min{SUM(y_i-y_p)^2}$$

當誤差越大表示無法反映現實情況。我們以下使用 keras 和 sklearn 進行實驗。
程式碼
sklearn
from tensorflow.keras.datasets import boston_housing
(x_train, y_train), (x_test, y_test) = boston_housing.load_data()
# 正規化
mean_feature_train = x_train.mean(axis=0)
std_feature_train = x_train.std(axis=0)

mean_feature_test = x_test.mean(axis=0)
std_feature_test = x_test.std(axis=0)

x_train = (x_train-mean_feature_train)/std_feature_train
x_test = (x_test-mean_feature_test)/std_feature_test

# 導入線性回歸模型
from sklearn.linear_model import LinearRegression
regression = LinearRegression()
regression = regression.fit(x_train, y_train)
# 預測
Y_pre = regression.predict(x_test)
print(Y_pre)
'''
array([ 5.55451294, 20.00731644, 20.55665365, 32.82302446, 25.64697477,
       19.45968834, 29.28312483, 25.38391555, 18.77010357, 21.69493081,
       18.90073817, 17.19404589, 14.76462193, 35.36471844, 16.94182469,
       20.19279347, 24.81663854, 21.40019897, 18.73374643, 21.50058781,
        9.01360171, 14.22493901, 21.76783427, 13.19477724, 22.92466903,
       22.95855583, 32.30713014, 26.99577554, 10.29743999, 21.23053674,
       22.74987751, 16.53696011, 35.95251346, 23.61151789, 16.90051536,
        1.47956779, 11.91196969, 21.84417768, 14.98432038, 28.78391568,
       23.44723764, 28.43262246, 15.54312803, 34.89119042, 30.93811614,
       24.03029827, 30.94630116, 17.31001806, 21.29586521, 23.85376225,
       32.55122546, 18.85538009,  7.39134469, 12.50987673, 35.31802235,
       27.58130985, 15.22470224, 40.22803819, 37.31630734, 24.68154074,
       24.58704989, 18.47862137, 17.33356639, 20.33194398, 24.51156031,
       25.44348413, 15.17899598, 27.98967896,  1.61585283,  7.79000193,
       21.99030399, 25.19471673, 22.64422388,  6.58951295, 29.16926758,
       21.24881594, 20.91593148, 24.45613791, 34.58678744,  3.31253496,
       24.01003208, 36.60015237, 16.62435866, 15.77682186, 19.8823582 ,
       18.7739659 , 20.10582024, 24.41995009, 22.4085753 , 28.25894098,
       17.1408851 , 17.99213613, 27.42088419, 29.91688329, 35.52379739,
       18.55880041, 35.9671986 , 37.01310323, 25.17154407, 40.6431914 ,
       33.44709717, 24.26252215])
'''
# 實際結果
print(y_test)

'''
array([ 7.2, 18.8, 19. , 27. , 22.2, 24.5, 31.2, 22.9, 20.5, 23.2, 18.6,
       14.5, 17.8, 50. , 20.8, 24.3, 24.2, 19.8, 19.1, 22.7, 12. , 10.2,
       20. , 18.5, 20.9, 23. , 27.5, 30.1,  9.5, 22. , 21.2, 14.1, 33.1,
       23.4, 20.1,  7.4, 15.4, 23.8, 20.1, 24.5, 33. , 28.4, 14.1, 46.7,
       32.5, 29.6, 28.4, 19.8, 20.2, 25. , 35.4, 20.3,  9.7, 14.5, 34.9,
       26.6,  7.2, 50. , 32.4, 21.6, 29.8, 13.1, 27.5, 21.2, 23.1, 21.9,
       13. , 23.2,  8.1,  5.6, 21.7, 29.6, 19.6,  7. , 26.4, 18.9, 20.9,
       28.1, 35.4, 10.2, 24.3, 43.1, 17.6, 15.4, 16.2, 27.1, 21.4, 21.5,
       22.4, 25. , 16.6, 18.6, 22. , 42.8, 35.1, 21.5, 36. , 21.9, 24.1,
       50. , 26.7, 25. ])
'''
keras
from tensorflow.keras.datasets import boston_housing
(x_train, y_train), (x_test, y_test) = boston_housing.load_data()

# 正規化
mean_feature_train = x_train.mean(axis=0)
std_feature_train = x_train.std(axis=0)
mean_feature_test = x_test.mean(axis=0)
std_feature_test = x_test.std(axis=0)
x_train = (x_train-mean_feature_train)/std_feature_train
x_test = (x_test-mean_feature_test)/std_feature_test

from tensorflow import keras
from tensorflow.keras import layers, Input, Model, optimizers
# 建立線性回歸模型
input = Input(shape=(x_train.shape[1],))
output = layers.Dense(1)(input)
model = Model(inputs=input, outputs=output)

algorithm = optimizers.SGD(learning_rate=0.01, momentum=1e-10, nesterov=True, name='SGD')
model.compile(optimizer=algorithm, loss='mse')
# 預測結果
model.predict(x_test[:8])
'''
array([[ 6.102955],
       [19.943102],
       [20.30687 ],
       [33.413998],
       [25.533064],
       [19.329035],
       [29.714052],
       [25.394867]], dtype=float32)
'''
# 實際值
print(y_test[:8])
'''
array([ 7.2, 18.8, 19. , 27. , 22.2, 24.5, 31.2, 22.9])
'''